Category Archive: Education disparities

What Do We Know about How Data Is Used to Improve Interventions for Engineering Students?

Published by Julie Smith, PhD, IACE

The percent of engineering degrees awarded to people who have not typically pursued engineering has increased since 2010, indicating strides in broadening participation. But there is still substantial underrepresentation for women and people from racially and ethnically marginalized groups. 

Using Data

Harnessing the power of data, including big data, can supporting broadening participation efforts in engineering. However, there are gaps in our understanding of how higher education faculty and staff use this data in the design of such interventions. 

For research conducted as part of the Engineering PLUS Alliance funded by the National Science Foundation, we explored how different institutions may use data in the process of designing efforts to sustain and grow engineering programs. We analyzed surveys completed by and artifacts generated by higher education faculty and staff who participated in a structured professional development and research experience. The experience focused on planning and executing a data-driven project designed to improve equity in engineering education via the stEm PEER Academy led by Drs. Claire Duggan and Jennifer Love. We explored why and how participants plan to use data in their design of interventions

Highlights of our Findings

Of the 38 participants in the program, 34 consented to participate in the research process. Participants in the stEm PEER Academy generated artifacts related to their plan to recruit and retain all students in engineering education on their campuses. This generation phase occurred after approximately 20 hours of professional development in the program.

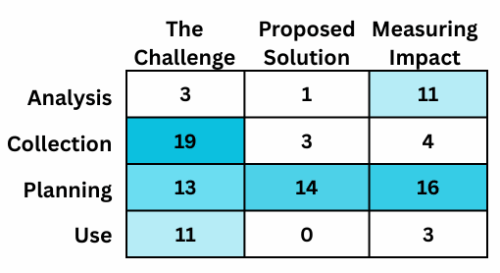
We performed a content analysis on these artifacts. As the table below shows, participants intend to collect, plan for the use of, use, and then analyze data. (Note that other possible categories – such as sharing and archiving data – were not found.) Participants plan to use data to define their challenges, proposed solutions, and impact measurement. The table also shows how common each combination of types of data use was.

Challenge, Proposed Solutions, and Measuring Impact

Understanding how participants used data is an important first step in determining how data use impacts project outcomes. Based on that finding, we can determine how to best support future cohorts as they design their interventions.

You can learn more about our work in our 2024 FIE paper: Data Use in the Design of Interventions to Improve Equity in Engineering Education

To cite this work, please use Smith, J. M., Love, J., & Duggan, C. (2024, October). Data Use in the Design of Interventions to Improve Equity in Engineering Education. In 2024 IEEE Frontiers in Education Conference (FIE) (pp. 1-6). IEEE.

This work is supported by the National Science Foundation under award HRD-2119930. Any opinions, findings, and conclusions or recommendations expressed in this material are those of the authors and do not necessarily reflect the views of the National Science Foundation.

“But They Just Aren’t Interested in Computer Science” (Part One)

Written By: Julie Smith

Note: this post is part of a series about the most-cited research studies related to K12 computer science education.

When discussions about the lack of women in tech occur, it is sometimes observed that the disparities exist because girls just aren’t as interested in studying computer science in school and women just choose not to work in the tech industry. 

This sentiment is horribly misleading. It is true that research shows that girls and women are, on average, not as interested in studying or working in computing. But what is important to understand is that interest isn’t like eye color: it’s not an inherent, biological attribute that simply reflects human differences. Rather, what we choose to be interested in is strongly influenced by what our culture conveys is appropriate for ‘people like us.’ This may seem to be an unusual way of thinking about the issue; we often assume that our interests are simply pure reflections of our personality and volition. But, at least for the case of interest in computer science, the evidence suggests otherwise.

In a recent report, Allison Master, Sapna Cheryan, and Andrew N. Meltzoff describe two experiments which show how (dis)interest in computer science can be influenced by very simple interventions. They created photographs of stereotypical (think: Star Trek posters) and non-stereotypical computer science classrooms and showed them to high school students and asked which classroom they would prefer. Girls were significantly more likely to express interest in the course in the non-stereotypical classroom. (Boys’ interest was not impacted.). In their second experiment, the researchers provided participants with a written description of a computer science classroom, some stereotypical and some not. Again, girls  were much more interested in a course in the non-stereotypical classroom. 

These two experiments are important because they show that interest in computer science isn’t hard-wired. Rather, it appears to be strongly influenced by whether computing is presented as conforming to stereotypes that aren’t as welcoming to girls. For those of us concerned with the negative effects of the lack of women in tech – not just on the women themselves but on a society that is ever-increasingly shaped by technology – these results are good news because they show that relatively simple interventions can increase girls’ interest in the study of computing.

Further Reading

Series

“But They Just Aren’t Interested in Computer Science” (Part Two)

“But They Just Aren’t Interested in Computer Science” (Part Three)

Longitudinal Trends in K-12 Computer Science Education Research

In this post, Bishakha Upadhyaya provides highlights of our SIGCSE 2020 paper on trends in K-12 CS Education research (co-authored with Monica McGill and Adrienne Decker). For more details, watch her talk or read the paper.  


Research in the field of Computer Science education is growing and so is the data and results obtained from it. Without a comprehensive look at them collectively, it can be difficult to understand the current longitudinal trends in the field. In order to identify the trends in the K-12 computing education research in the US, we conducted a longitudinal analysis of data collected from five different publication venues over the course of 7 years.

For the purpose of this analysis, we looked at the manually curated dataset on csedresearch.org with over 500 articles that focused on K-12 computing education from years 2012 to 2018. As the majority of the articles in the dataset were from the US, we only looked at research papers whose participants were also from the US. We then ran SQL queries on the dataset in order to extract the subsets of data that were later analyzed in Tableau and presented visually using graphs and tables.

Some of the major trends that we were interested in examining were:

  • Locations of students/interventions studied
  • Type of articles (e.g., research, experience, position paper)
  • Program data (e.g., concepts taught, when activity was offered, type of activity, teaching methods),
  • Student data (e.g., disabilities, gender, race/ethnicity, SES)

Results revealed that there has been an increasing shift in classroom activities from informal curriculum to formal curriculum. This shift suggests that more research is being conducted within classes offered during school hours, increasing the reach to more students with the availability of more labs, lectures and other teaching methods.

Trends also revealed that the majority of the research papers had student participants based in California. While this may seem reasonable given California is the most populous state in the US, this trend doesn’t follow for Texas, the second most populous state. There were only 4 papers that represented participants from Texas. This suggests that policies and other standards may have an influence over the computing activities and research in the state.

Locations of participants in research studies
Locations of the student participants studied.

Our analysis revealed another longitudinal trend, various disparities in reporting the student demographics, particularly the socio-economic status (SES) of the students. For the purpose of this analysis, we considered information about free/reduced lunch as low SES if not explicitly reported in the paper. Only 32 of the articles analyzed reported information about students’ SES. Despite previous evidence showing that the SES of the student affects their academic achievement, the underreporting suggests that it is still not being considered in many research studies.

Socio-economic status among participants
Socio-eonomic status as reported in studies. Low SES reflects students from low income households and/or qualifying for Free/Reduced lunch at school.

In a field with increasing efforts to increase the number of students from different backgrounds studying computer science, our research has shown considerable disparity in the research landscape of computing education. The lack of reporting makes it difficult for everyone from researchers and educators to policymakers to understand the results of these efforts, especially what needs improving. It is crucial to see how different interventions play out amongst different populations in order to implement and achieve the goals of CS for All.


Bishakha UpadhyayaBishakha Upadhyaya is a Senior at Knox College, majoring in Computer Science and minoring in Neuroscience. She was the President of ACM-W chapter at Knox for 2019/2020 school year and served as the CS Student Ambassador. She was involved in this research as a part of her summer research project. As a part of her senior research project, she was involved in exploring the enacted curriculum in Nepal, Pakistan, Bangladesh and Sri Lanka. She will be joining Bank of America as a Global Technology Analyst after graduation in Spring 2021.